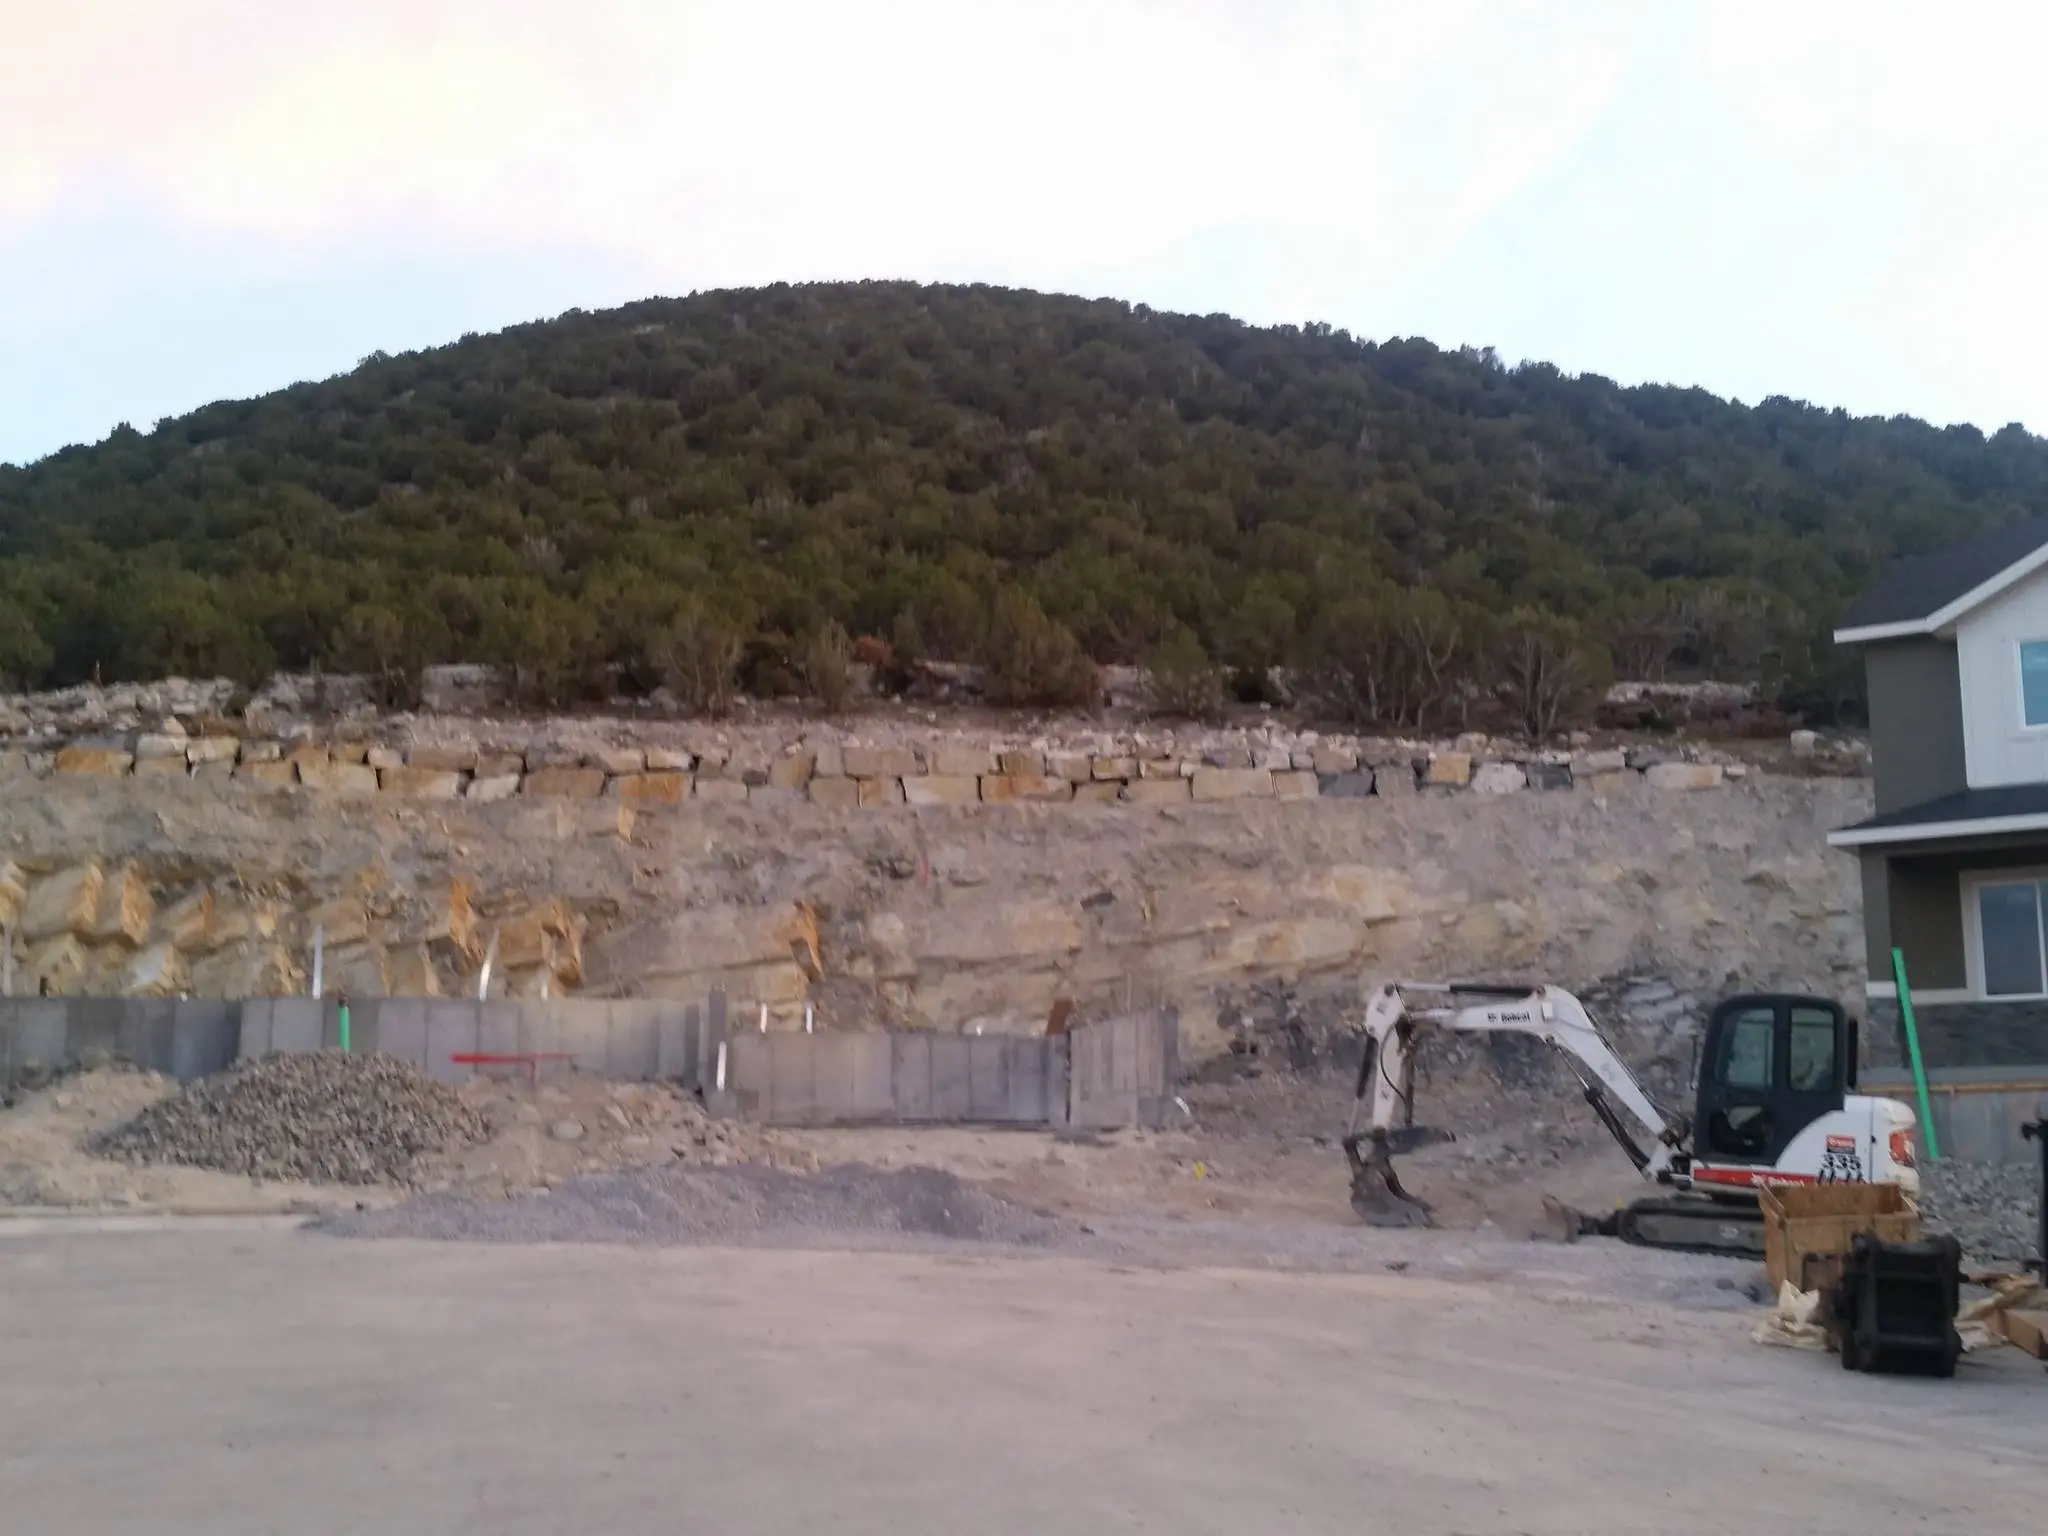
Eagle Mountain has had some controversy surrounding the blasting that has happened in the city the last couple of years. The City, Residents, and Developers have been at odds about blasting in the city causing damage to occupied houses close to the blasting sites. The city has currently passed ordinances to limit the types of blasting and has put more regulations in place to help protect the residents of Eagle Mountain. City Staff is currently also looking into modifying the blasting ordinance to not allow developers to blast so that they can build on lots that have grades that do not allow building. The city has a slope ordinance in place that does not let developers build on any land that has an average slope of 25% or more.
Data from Monitoring Stations
During each of the blasts the events are recorded by instruments that measure the sound waves created by the blasting, their strength, and speed. This is an example of one of the graphs created by the monitoring instrument.
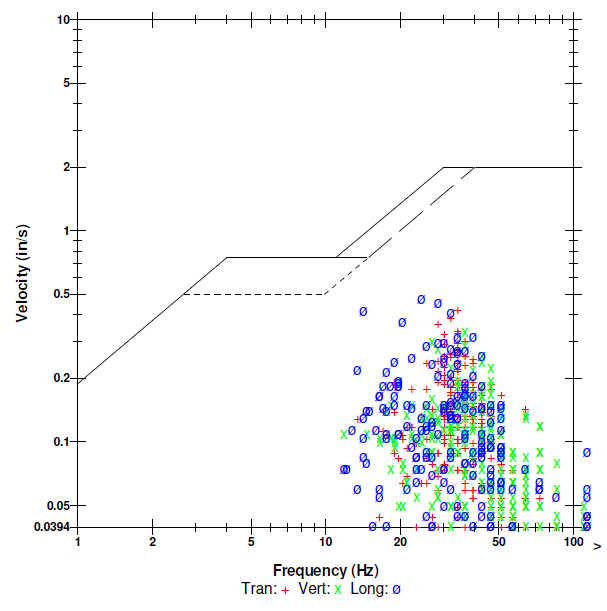
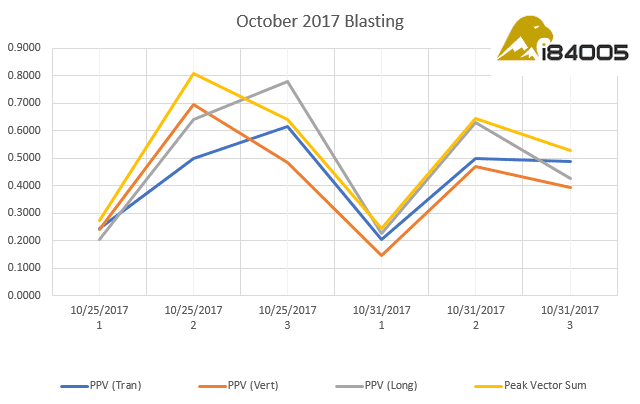
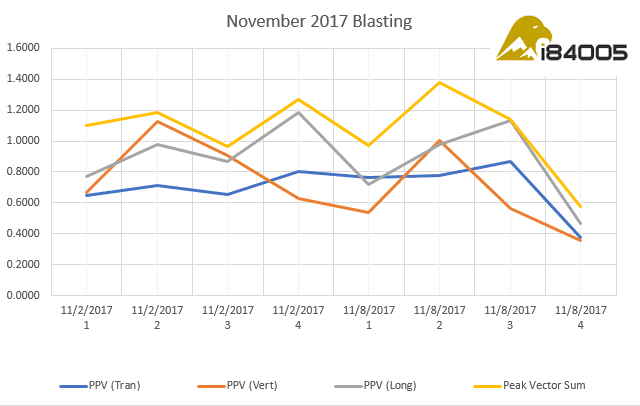
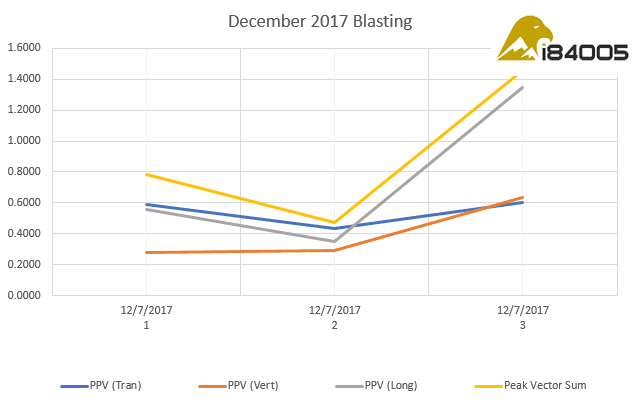
Seismographs measure vibrations in three axes; north-south, east-west and vertically. Each type of vibration is then characterized based on their Peak Particle Velocity, (PPV) and mapped on the chart above.
TRANS: Transverse waves are also called secondary waves. These waves displace the ground in a perpendicular direction.
VERT: Vertical waves are very similar to waves in water and travel along the Earth’s surface. Because of their low frequency, long duration and larger amplitude, they can be the most destructive and are usually what causes damage during earthquakes.
LONG: Longitudinal waves are the primary waves that travel the fastest. They are comperssional in nature and can travel through any material. In air, these waves take on the form of sound waves.
Data was collected as each blast was done, and each of the Blast Event Reports data has been entered into this spreadsheet. I have tried to be as accurate as possible, but if you see something you question, please review the actual BER to verify the data. Below are some charts that are summary of the data in the spreadsheet.
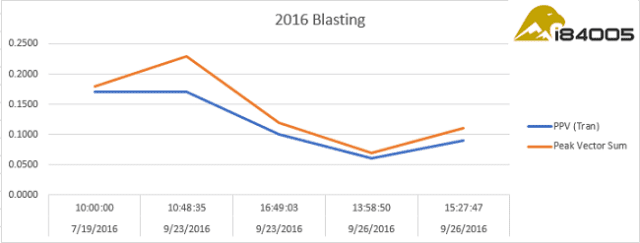
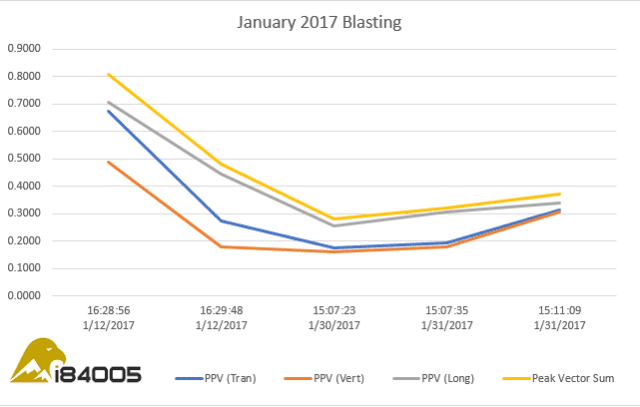
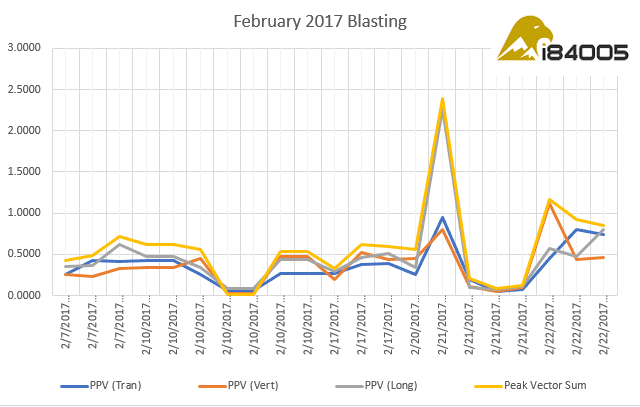
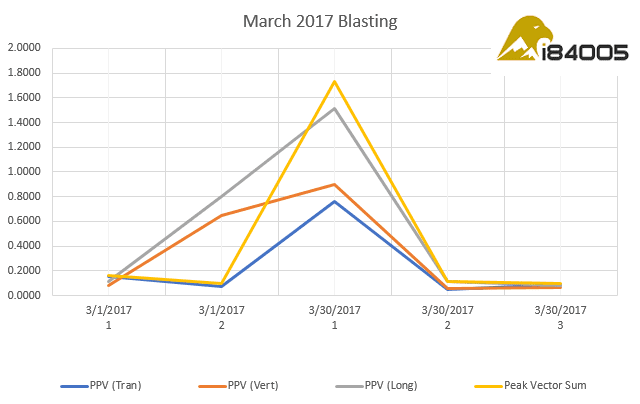
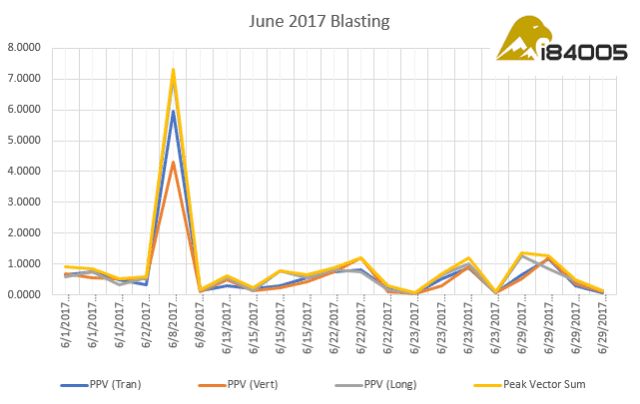
The largest values found in a 2017 BER were on 6/8/2017, the report is below.
It should also be noted that on 6/23/2017 there was a monitor error when monitoring Skyline Ridge House 7253, the report is below.
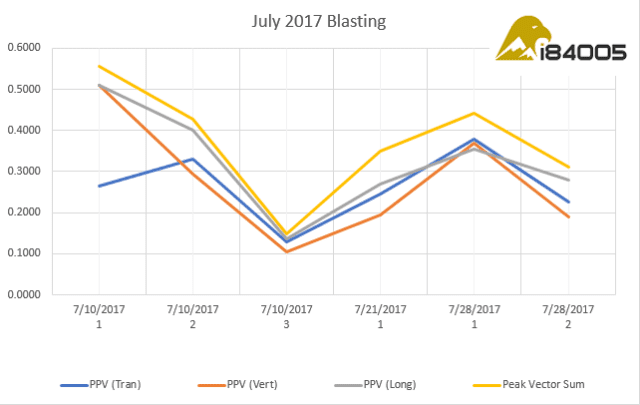
Terms Used in Event Reports
PPV = Peak Particle Velocity
“Particle velocity is the velocity of a particle in the ground as a vibration disturbance passes by. Not to be confused with propagation velocity which is the travel velocity of the vibration. Whenever a material is vibrated, its particles experience displacement, velocity and acceleration.
A modern blasting seismograph directly measures particle velocity, usually given in units of in/sec or mm/sec. The measurement is made in three mutually perpendicular directions called the radial (longitudinal), vertical and transverse. Each vibration will have a greatest amount of particle velocity on each of the three channels. The peak particle velocity is the largest of these three values.” – http://www.whiteseis.com/support
ZC Feq = Zero Crossing Frequencies (This value is not used in the charts above)
“A zero-crossing is a point where the sign of a mathematical function changes (e.g. from positive to negative), represented by a crossing of the axis (zero value) in the graph of the function. It is a commonly used term in electronics, mathematics, sound, and image processing.” – wikipedia
Peak Acceleration (This value is not used in the charts above)
“Peak ground acceleration (PGA) is equal to the maximum ground acceleration that occurred during earthquake shaking at a location. PGA is equal to the amplitude of the largest absolute acceleration recorded on an accelerogram at a site during a particular earthquake.” – wikipidea
Peak Displacement (This value is not used in the charts above)
“Particle displacement or displacement amplitude is a measurement of distance of the movement of a particle from its equilibrium position in a medium as it transmits a second wave. – wikipedia
Peak Victor Sum
“The peak vector sum (PVS) is usually also quoted; it is simply the square root of the sum of the squares of the PPV values in all three vector directions measured by the seismograph. PVS is a “scalar” quantity, i.e. one with only a value, which is always larger than the individual PPV vector values. Scientific studies have shown that the PPV correlates best with damage potential of all the tested characterizations of ground movement (e.g. acceleration, displacement, or strain). Virtually all the standards are quoted in PPV values, not PVS or other measures of movement, although the “acceptable” values of PPV differ with the standard applied and with the frequency of the vibration components.” – https://www.proz.com/kudoz/english_to_french/construction_civil_engineering/6237698-peak_vector_sum.html
Mike Kieffer – Editor-in-Chief, Cedar Valley Sentinel
Mike Kieffer is a dynamic leader and community advocate based in Eagle Mountain, Utah. He serves as the Editor-in-Chief of the Cedar Valley Sentinel, a local publication dedicated to informing, inspiring, and elevating the Cedar Valley community through honest and accurate journalism. With a passion for fostering connections, Kieffer has made it his mission to highlight local businesses, provide reliable news, and support community development.
Beyond his editorial role, Kieffer is the owner of Lake Mountain Media, LLC, a company specializing in media and communications, and the co-owner of Quail Run Farms, which focuses on sustainable farming and community engagement. He also actively contributes to the local economy and culture as a member of the Eagle Mountain Chamber of Commerce.
Kieffer’s dedication extends to preserving and promoting the history and heritage of the Cedar Valley area. He often participates in community-centered events and media, including podcasts that explore the unique aspects of life in the region. Through his varied endeavors, he remains a steadfast advocate for the growth and enrichment of the local community.
